Showing posts with label efficiency. Show all posts

Thursday, December 3, 2015

Automating Password Management

I have a password that I don't particularly need to be super secret, but I don't really want to memorize another password either.

I  put together a script that will automatically copy the password to the clipboard (essentially a Control + C command of text). I threw this into a project folder and I can run the script quickly by double clicking it.

For the sake of slight security, I named the file something boring and unrelated.

Code

from Tkinter import Tk
r = Tk()
r.withdraw()
r.clipboard_clear()
r.clipboard_append('password')
r.destroy()


Setup

  • Install Python if it's not already installed
  • Copy the code above
  • Paste into Notepad or another text editor
  • Replace the highlighted password with your own password
  • Save as type: All Files (*.*)
  • File Name: "SomeFileName.py"
    • Wrapping the filename in quotes ensures the file type will be set to .py - a python script file
  • Double click on the file to run it. A Python window will briefly open and close automatically
  • Navigate to a text area and hit Ctrl+V or use some other paste command

Friday, February 14, 2014

Manage SD Card Media with an Android Tablet

I love my Nexus 7.  It's the 2012 version and when I got it for Hanukkah, I pretty much entirely stopped using my laptop.  It's a large enough screen while still being small, light, and portable. It's powerful enough to be a solid graphics post-production workstation for photos from my adventures, and it was quite a bit less expensive than similar tablets.  There are tons of really powerful (FREE) apps that can tune my pictures and really make my photos pop!

The only drawback to the Nexus is that I've had to transfer media from my old GoPro HD Hero or my point & shoot camera to an intermediate device before I can dig into editing the files on the tablet.  I'll have to:
  1. Connect the camera/card to a computer
  2. Transfer the files to the computer
  3. Connect the tablet to the computer and transfer again, or e-mail the photos to myself
This also implies that I have both a mini-USB cable for the cameras, and a micro-USB cable for the tablet.

Solution:


  1. Any micro-USB OTG cable ("On The Go" cable): $1-2

  1. Nexus Media Importer app: $4 on Google Play

Setup:

  1. Buy the card reader and the OTG cable. With shipping, it's still probably under $10.
  2. Download Homesoft's Nexus Media Viewer and test out your new cable and card reader. If you can successfully view photos with this app, uninstall it and buy the Nexus Media Importer app
That's it! It's a pretty solid app.  Simple to use, simple to copy data to your tablet, and it has some pretty sweet methods to select the specific files or groups of files that you want out of a given directory.

It also works for other types of data (video, music, documents, folders, etc.)

Tuesday, November 6, 2012

Free GIS Data & Resources

Utilities

QGIS - Free, open source GIS software

ESRI's ArcExplorer is a free program to use to view GIS data

Minnesota Deptartment of Natural Resources Garmin Data Formatter

EasyGPS
Transfer files between your GPS unit and computer

Google Earth

SeaDAS
Free software for the display and analysis of MODIS and other imagery

BEAM
Open source software for viewing, analyzing, and processing remote sensing imagery


Data


Florida

Florida Department of Environmental Protection's GeoData Directory
Lots of accurate and basemap layers with very well managed metadata

FDEP's Map Direct (Internet Explorer only)
Interactive internet mapping application with DEP's GIS data

FDEP's Land And Boundary INformation System ("LABINS")
Orthophoto imagery, raster basemaps, Digital Elevation Models (DEMS), and other high resolution imagery and surveying data for the state of Florida.

Florida Department of Transportation Aerial Photography
High resolution historical imagery of Florida

FDOT's GIS Directory
Florida traffic information & transportation networks

Florida Geographic Data Library (FGDL)
Lots of Florida data (statewide, or by county), but much of it is antiquated.  I'd look at FDEP's Geodata Directory first.


Beyond Florida

The USGS National Map
Topo maps, historical data, etc.

Minnesota DNR Data Deli (Retired)
Minnesota Geospatial Commons

Lakes Data for Minnesota
Including outlines, DEMs, & contours

MIT's Geodata Repository
Use the navigation on the left to browse through lists of US nationwide, statewide, and worldwide datasets

Stanford University Libraries & Academic Information Resources
Marine Biology GIS Data

GPSFileDepot.com Garmin GPS Maps
Browse for a number of useful layers

Harvard Geospatial Library

Minnesota GIS/LIS Consortium's list of GIS resources

Data.gov - Geospatial One Stop
Browse US maps & data

Bathymetry

NOAA's National Geophysical Data Center
- Maps & Scanned Images
- U.S. Coastal Relief Models

Imagery

OceanColor Web
Search and download various multi-spectral imagery

USGS Global Visualization Viewer
Search, download, and learn about various imagery


ITT Visual Information Solutions' ENVI tutorials

Wednesday, August 29, 2012

Combine Matching Datasets

I have multiple text documents that contain pipe delimited data (|).  It would be much easier to work with if the information could be appended or otherwise combined into a single data file.

My data are currently stored as 16 individual .txt files, however it would be nice to know how to convert comma seperated data (.csv format),or any other simple text files as well.  We can easily combine these using a simple, one line DOS/command prompt command.

16 data files are a nightmare.

Merge documents from a DOS/command prompt:
  • Click Start :: Run, type cmd and hit enter to bring up a command prompt
  • Use CD (Change Directory) commands to navigate to the desired working directory of your individual datasets
  • Use the copy command to create a new file that contains a copy of all of the datasets together.  See below for syntax and examples
Syntax:

copy *.[format] [output_filename].[format]


In English this instruction says, "copy the contents of all files in this directory of a certain file format to a new file named whatever."

Example:

copy *.txt combined.txt


Command prompt view:
View of running the copy command

Output folder view:
A single, appended file is wonderful, but it'll need some minimal formatting

Remove headers stored as records:
The data are likely to have originally been exported with field names/headings in the first row.

Three individual text files with a header in the first
row that provides field names for each dataset

These will be included in the output file because the copy function appends every line of the originating datasets into a the new file.

The copy command appended the field headings
into the dataset.  These will need to be removed.
Removing these can be as simple as importing the file into spreadsheet processing software, such as Excel, and manually looking through the dataset for these lines and deleting any of those rows.  Of course we will leave the very first row of these alone since we will likely want one dataset header at the beginning of the file.  The remaining instance will otherwise be stored as actual records and that is incorrect.

Another way is to import the dataset into a database such as MS Access and run a SQL query to remove the erroneous records:

SQL syntax:

DELETE FROM [table name]
WHERE [field 1 name] = "[
field 1 name]" AND
      [field 2 name] = "[field 2 name]";


This will begin by attempting to delete rows from the table that was imported.  The query is limited to records where the data in a field matches the heading.  An AND statement is used to make sure it was not a coincidence that the data matched the field heading.  This can be repeated for each field in the dataset if necessary.  Here's an example from my data.

Example statement:

DELETE FROM GWISUpdates
WHERE station_id = "station_id" AND

      resource_type = "resource_type";


Friday, August 12, 2011

Connect to ArcMap layers and tables with VBA

Example description:
I am editing a coverage of stream segments (lines) and would like to log any updates to a non-spatial, standalone table in the geodatabase so I can keep track of the evolution of the dataset over time.  The application will first need to know which datasets to edit, so I start by adding  two combo boxes to the form that will be automatically populated with the two necessary types of data, named cboFlowingWatersLayer, and cboFlowingWatersUpdateTable, respectively.


The first combo box will allow me to select any of the the spatial datasets (geodatabase coverages/feature classes/shapefiles/projected datasets/etc.) that are available in the Table of Contents pane:

Map layers in an active ArcMap project

The second combo box will select the non-spatial, standalone table (highlighted below) that is otherwise available under the Source tab in the Table of Contents pane.  There are two additional dummy tables that I added to this project that are not visible in the screenshot below, but you'll see them later.

Non-spatial tables in an ArcMap project

Coding:
I add some code to populate the combo boxes with any available layers or standalone tables when the form activates.  There's a brief Setup section, then an If/Then statement will check to see if there is a layer already set in there.  If not, it'll clear it and populate the control with any spatial layers that are available.  If there is anything in there, it will run a separate function to check if it's the right layer.  I won't address that procedure here, so it's commented out below (though I recommend adding such a function). Let's get started with filling in the names of just the spatial datasets first:

Private Sub UserForm_Activeate()
'Setup
  Dim pMxDoc As IMxDocument
  Dim pMap As IMap

  Set pMxDoc = ThisDocument
 
Set pMap = pMxDoc.FocusMap

'Populate the first combo box with any available spatial
' layers that will show up in the Display tab in the
' ArcMap Table of Contents pane
  Dim i As Integer
  If cboFlowingWatersLayer.ListCount = 0 Then
      cboFlowingWatersLayer.Clear
      For i = 0 To pMap.LayerCount - 1
          Me.cboFlowingWatersLayer.Additem (pMap.Layer(i).Name)
      Next i
  Else
      'Call Me.FlowingWatersLayerCheck
  End If

End Sub

What should appear when the first combo box is selected are any layers that are available the Display tab of an ArcMap project.


(Note that apps can only work with shapefiles, geodatabase coverages, etc. and not groups of data.  Data groups appear in this example as individual layers, but since they are not really spatial datasets, selecting them will cause an error at run time if they are selected and processed.)

Next we'll add some more code to add any standalone tables that are in the project using the IStandaloneTableCollection interface:

Private Sub UserForm_Activeate()
'Setup
  Dim pMxDoc As IMxDocument
  Dim pMap As IMap
  Dim pSATCollection As IStandaloneTableCollection 

  Set pMxDoc = ThisDocument
 
Set pMap = pMxDoc.FocusMap
 
Set pSATCollection = pMxDoc.FocusMap

'Populate the first combo box with any available spatial
' layers that will show up in the Display tab in the
' ArcMap Table of Contents pane
  Dim i As Integer
  If cboFlowingWatersLayer.ListCount = 0 Then
      cboFlowingWatersLayer.Clear
      For i = 0 To pMap.LayerCount - 1
          Me.cboFlowingWatersLayer.Additem (pMap.Layer(i).Name)
      Next i
  Else
      'Call Me.FlowingWatersLayerCheck
  End If

'Populate the second combo box with any available non-spatial
' tables that will show up in the Source tab in the
' ArcMap Table of Contents pane
  Dim j As Integer
  If cboFlowingWatersUpdateTable.ListCount = 0 Then
      cboFlowingWatersUpdateTable.Clear
      For j = 0 To pSATCollection.StandaloneTableCount - 1
          Me.cboFlowingWatersUpdateTable.Additem _
              (pSATCollection.StandaloneTable(j).Name)
      Next j
  Else
      'Call Me.FlowingWatersTableCheck
  End If

End Sub

Finally, this is what the second combo box will look like (with the additional two dummy datasets that were hidden from view in the screenshot above - they're named "Delete - Test 1" and "Delete - Test 2"):


Referencing the selected layer/table:
There are a virtually unlimited number of uses for mapping layers like this.  The idea is that the method above provides a heads-up interface to access the position of a given layer or table in the Table of Contents.  Think of the position as the dataset's number in line, starting at 0 instead of 1.  Take the five spatial "layers" that are available for example:

Place in lineVB Position #Layer Name
1st / Top
2nd
3rd
4th
5th / Bottom
0
1
2
3
4
"FlowingWaters layer"
"New Group Layer"
"Florida NHD"
"SWFWMD_draft_primary_canals"
"Reporting Units"

Whenever you need to use a specific layer, the interface we built above will allow a quick way for Visual Basic to reference the position number of a selected layer.  Of course you will need some error checking and handling code to ensure that the layer position isn't changed (adding, removing, or moving the order of layers in the Table of Contents will affect each layer's position number).

The following are a few examples on how to reference a layer's position number using the interface that we built above.

Example 1 - Connect to a dataset:
A working example follows, so don't worry about the function of the code yet.  This simply illustrates the structure of references needed to connect to a dataset.

The previous sections explain that an ArcMap project is made of up layers and sometimes non-spatial tables.  Further, those layers and tables have position numbers associated with them that are usually just unimportant background information.  Well, now we will use those position numbers to tell a program where to target its procedures.

After we choose a layer from the program interface, that combo box/pull down menu will store our selection as a number, which it refers to as its ListIndex.  Now if we want to know which layer or table we chose, we'll call it by referencing cboFlowingWatersLayer.ListIndex.

In the example below, we are instantiating a new variable based off of the IFeatureLayer interface (again, don't worry about what's happening yet).  We will set that new variable, named pFeatureLayer, equal to a specific layer number (position number) in an ArcMap project so we can do some more work on it later.  Just pay attention to the way that the combo box position is referenced:

Dim pMxDoc As IMxDocument 'Whatever
Dim pFeatureLayer As IFeatureClass 'Slightly Important
'...more code

Set pMxDoc = ThisDocument 'Still not the point
'Oh, here we go!
Set pFeatureLayer = _
  pMxDoc.FocusMap.Layer(cboFlowingWatersLayer.ListIndex)
'...more code


Ok! This essentially told the function/sub routine that:
  1. We're working with this project (aka ThisDocument)
  2. We're looking for a specific feature layer (spatial dataset/shapefile/geodatabase coverage/etc.)
  3. That dataset of interest will be in a certain position when you focus the map; and that position number can be found by A) looking at the combo box (pull down menu named cboFlowingWatersLayer) and B) pulling its current ListIndex value.
Got it.  Let's move on to a working example.

Example 2 - Count the selected spatial features:
Add two command buttons to the form, named cboLayerCount & cboTableCount, and change their captions to match the screenshot below

Added two command buttons

When a user clicks on one of these buttons, a message box will report how many records are selected in a layer or a table.  I'll add a quick error check at the beginning to make sure that a layer has been selected.  If a layer has not been selected yet, the ListIndex value will be -1. Here's the code:


Private Sub cmdLayerCount_Click()
'Error Checking
  If cboFlowingWatersLayer.ListIndex = -1 Then
      MsgBox "Please choose a layer to count."
      Exit Sub
  End If

'Setup
  Dim pMxDoc As IMxDocument
  Dim pMap As IMap
  Dim pFS As IFeatureSelection
  Dim pSelectedFeatures As ISelectionSet

  Set pMxDoc = ThisDocument
  Set pMap = pMxDoc.FocusMap
  Set pFS = pMap.Layer(cboFlowingWatersLayer.ListIndex)
  Set pSelectedFeatures = pFS.SelectionSet 

'Display a message box to report info
  If pSelectedFeatures.Count = 1 Then
    MsgBox "There is 1 feature selected."
  Else
    MsgBox "There are " & pSelectedFeatures.Count & _
        " features selected."
  End If

End Sub

Save this, run the code, select a few features and you should get something like this:


Example 3 - Count the selected standalone table features
Using the same GUI (graphic user interface) that was built in the previous example, apply the following code to the "Table Count" command button to count the number of selected records in a standalone table.  A very similar method will be used for this procedure, however we will need to use the ITableSelection inteface in place of the IFeatureSelection interface since we're working with a standalone table instead of a spatial dataset.  Further, I won't need to sort through any of the selected features in the standalone table in my larger project, so I'll leave out the Selection Set and count directly from my Table Selection:

Private Sub cmdTableCount_Click()
'Error Checking
  If cboFlowingWatersUpdateTable.ListIndex = -1 Then
      MsgBox "Please choose a layer to count."
      Exit Sub
  End If

'Setup
  Dim pMxDoc As IMxDocument
  Dim pSATCollection As IStandAloneTableCollection
  Dim pTS As ITableSelection

  Set pMxDoc = ThisDocument
  Set pSATCollection = pMxDoc.FocusMap
'This next bit must be on the a single line;
'  the format of this blog makes coding difficult.
  Set pTS = pSATCollection.StandaloneTable(
       cboFlowingWatersUpdateTable.ListIndex)

'Display a message box to report info
  If pTS.SelectionSet.Count = 1 Then  
      MsgBox "There is 1 feature selected."
  Else 
      MsgBox "There are " & pTS.SelectionSet.Count & _
          " features selected."
  End If

End Sub

Now, after you map a standalone table in the Flowing Waters Update Table combo box and click the Table Count command button, you will be able to count any selected records in the table, just like you would count the records in a spatial layer.


Friday, June 24, 2011

PivotTables Example: Reducing Multiple Records for One Site

Click to enlarge: Example dataset and completed PivotTable
There is a dataset that has unique records for various pollutants for a number of locations across the state.  Thus, there are multiple instances of the same station for each of the four pollutants in this abbreviated example: CO, NOx, PB, and PM (etc.).  I gave each of these records imitation data in the Value_ppm field to illustrate how the data are moved after being manipulated by the PivotTable process.  The values for the first station group are 1.x, the second group are 2.x, etc.

Process:
  • Open a dataset in Excel (2007) - though this is largely available in previous versions of Excel.
  • From the Insert tab choose Pivot Table
 
  • From the Create PivotTable dialog, select all of your important data (including field headings), and choose to place the new table in a New Worksheet
  • From the PivotTable wizard that will likely appear docked to the right side of the Excel window, click the menu button at the top and choose "Fields Selection and Areas Stacked" option
 

  • Select the fields you wish to be included in your final dataset.  I picked all three from my dummy dataset
 
  • Select the menu button again at the top of the PivotTable wizard and choose “Areas Section Only (1 by 4)”
  • Now drag the fields into the following order:
    - Row Lables: Station (or station name/id)
    - Column Labels: Pollutant
    - Values: Sum of Value_PPM
 
  • Remove the "Grand Total" fields by right clicking on the new table and choosing PivotTable Options
  • From the Totals & Filters tab, uncheck the first two boxes under Grand Totals and click OK
Final Table
  •  Finally, Copy and Paste the raw field headings and data to a new, final worksheet.  From here, if you are dealing with spatial data, I suggest joining Lat/Long/Datum information to the Station in Access or ArcMap/Catalog
Additional Grouping Fields:
Your dataset will be a bit more difficult if you need to attach additional information included as a grouping parameter, such as an observation date.  You can start by adding the Date column (switch back to the “Fields Selection and Areas Stacked” view) to the Row Labels area of the Pivot Table wizard.  Make sure Date is first, followed by Station.

Further grouping by Date
  • If this last table is useful, you may want to remove the group subtotals before you copy the raw data into a new worksheet.  Simply right click on a Date cell inside the newly created table and uncheck the Subtotal "Date" option

Monday, January 3, 2011

Remove Cryptic Folders in XP


I've seen a lot of these weird, cryptic folders appearing on the root of my Windows XP machine for a while but never knew what to do with them.  I had data "Ghosted" over from a previous hard drive that had a mechanical failure, and most of these appeared after the recovery.  These are all seemingly random combinations of letters and numbers between 20 and 30 characters long on the root of my master hard drive (C:\).

Reading a few forums/technical documents gave me the impression that these are temporary directories and files that are left over from updates that have occurred in the past.  These should have been automatically removed, but they are often left behind.  Other users in my office have a couple of such folders laying around, and my computers at home have one or two as well, although my work machine has a couple dozen, which take up almost 3 GB of hard drive space!  As far as I can tell, these left over, benign files can and should be removed.

Attempting to delete any of these folders simply return security/access errors, so I tried to delete them using Windows Explorer in Safe Mode.  No luck.  I then tried using a del command in Safe Mode's Command Prompt.  No luck either.

The trick is to set Delete permissions for the administrator/user.  It may help to be in Safe Mode, but I was able to delete some without being in Safe Mode.  My account also has Administrative privileges, so that is more likely necessary.

The following are two methods for removing these data.  "Individually" contains the method that illustrates how to access the specific setting that is restricting these files/directories from being deleted.  "En masse" is a faster method to delete all of these folders at once.

Remove Individually:
  •  Right click on a folder or a file and select Properties
  • Navigate to the Security tab and click the Advanced button toward the bottom of the dialog box
  • Highlight one entry at a time, starting with Administrators, and choose Edit (or just double click an entry to edit its permissions)
  • Scroll down and check the box to Allow this entity Delete permissions.  Remove any Deny permissions if that happens to be selected, but these boxes should be blank.  Click OK once to return to the "Advanced Security Settings for [Folder Name]" dialog
  • Repeat the previous two steps for teach additional entry in this list.  Others may include SYSTEM, CREATOR OWNER, Users [...], etc.
  • Now deleting the folder or file should not return any errors and the data can be deleted normally
Remove En Masse:
  • Select all cryptic folders.  Be sure not to include system/necessary program folders in this selection (see the graphic at the top of this article)
  • Right click and select Properties to open the properties for all directories
  • Click on the the Security tab.  You will be prompted with a Security warning
  • When prompted, choose Yes to reset security permissions for all selected folders
  • All permissions will now be reset to "Allow," specifically the Delete process
  • Now deleting the folders or files should not return any errors and the data can be deleted normally
Additional resources:
 - How to take ownership of a file or a folder in Windows XP

Monday, July 12, 2010

Browser Spellchecking: Text areas and text boxes


I love Mozilla's dictionary extension/add-on, though I noticed that it only works on text areas (blog entries, facebook comment boxes, etc.) as opposed to other one-line text boxes (blog titles, "Enter your name" type fields).  It turns out that this is a setting that can be changed so all text input boxes can be checked for spelling.  Also, it's not difficult to change either:

Using Mozilla:
  • type about:config into the URL address bar and hit Enter
  • take note of the resulting message, warning users to be careful with any changes and click the, "I'll be careful, I promise!" button to bring up a list of all of the preferences available in the browser
  • type layout.spellcheckDefault into the filter and double click on the matching result to change the setting from 1 to 2
    • 0 = Disable Spellchecker
    • 1 = Enable Spellchecker for multi-line controls (default)
    • 2 = Enable Spellchecker for multi- and single-line controls
  • Click OK to save the parameter
That's it!  Change it back to 1 if you don't like it, though I find it to be pretty useful.

    Thursday, May 27, 2010

    Formatting Spreadsheet Cells with Unit of Measure

    I'm working with data imported from a GPS unit. The Altitude field is reported by a value with the unit of measure tacked on the end (below).


    The extra characters after the numeric value need to be removed if this value is going to be used in a database or a spreadsheet.  As of now it's being stored as a text value and is not as useful for calculations, summarizations, or sorting.

    The general idea is to use only a certain amount of text from the left side of the Altitude values, however there are various lengths of numbers. "11" and "-4" are both composed of two characters, but "2" is made up of one character.

    The best course of action is to remove those last three characters from each value so it can be treated as an integer (or other numeric value).  The best way to do this is to combine two simple and powerful functions into a spreadsheet formula.

    Function SyntaxDescription
    Length =LEN(text) Returns the length of a string including spaces. Text is the text (or cell) whose length is to be determined.
    Left =LEFT(text, number) Returns the first character or characters in a text string. Text is the text (or cell) where the initial partial words are to be determined. Number (optional) is the number of characters for the start text. If this parameter is not defined, one character is returned.


    Length example:
    The length function returns the number of characters that are present in a cell


    Now that we know how many characters are found in each individual record, we can create a formula that will pull just the specific numbers we want using the Left function.

    Combining with the Left function:
    The following formulas return only a certain number of the Left most characters from the Altitude field.  That number is calculated by subtracting 3 (a single space and "ft") from the total length of the Altitude field.


    Sometimes Google Docs treats this text field as a number already, so the formula doesn't need to include the -3 (i.e. simply testing the =LEN(C2) formula returns 2 instead of 5).


    The Right function is very similar to the Left function.  The Mid function, on the other hand, is used to report strings that do not begin on the ends of a cell, but rather when information begins closer to the center or more than one character away from the left most position. Check out the "Decimal Degrees to Degrees, Minutes, Seconds (DD to DMS):" section of my post on Angular Unit Conversion for an example.

    Friday, April 23, 2010

    Attribution Assistant: Toolset/Plugin for ArcMap 9.x

    Attribution Assistant icon

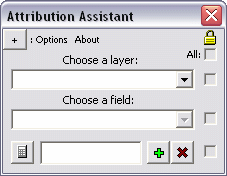
    Attribution Assistant interface


    This (free) application is a plugin for ArcMap 9.x that allows a user to rapidly attribute GIS data.  Simply launch the tool from a button on the ArcMap interface to begin (installation instructions below).  Use the two menus to choose an available layer and a field to attribute.  Next, type a value in the text box, select some features, and press the Calculate button to quickly apply the attribution.  It's as simple as that.

    Features:
    Use the Add and Remove buttons to manage up to 16 attribution values.

    Use the check boxes to "disable" a specific field or restrict access to altering the current properties - this prevents the manipulation of information.  The topmost check box enables or disables all other check boxes at once (see graphic below).  Click the button in the top left corner to expand a few extra features (see below).

    A layer and field are set with four attribution values

    Use the Mirror tool to flip the interface for easier access to a particular control (see below).  For instance if you would rather have the Attribution Assistant sit on the left side of the screen, a user can flip the interface so the mouse does not have to travel as far to click the Calculate button.

    The interface is reversed with the Mirror tool

    Minimize the Attribution Assistant application with the Minimize button.  When you launch the tool again from the main icon on the ArcMap interface all settings will be preserved.

    Use the Import button to automatically populate the attribution boxes with (up to 16) unique values that exist in the dataset in decreasing order.

    Uses:
    • Basic attribution - select features on-the-fly with the Select Features Tool and click the calculate button on the Attribution Assistant to apply the custom value to each of the selected features. Add a blank text box that can be used to clear an existing value.
    • In an editing session - use the Attribution Assistant in an editing session to quickly attribute data as it is being digitized.  Rather than clicking inside the Attributes dialog (launched from the Editor toolbar ) or clicking inside a cell in the Attribute Table and typing a (or pasting a copied) value for each new feature, one can simply close the polygon, click a single button to apply attribution, and continue.
    Dynamic Help:
    Click on any label to bring up a small explanation for each feature in the application.  Look for the Help pointer as you hover over a label

    Installation:
    View the installation instructions for this tool in the article titled, "Install Non-Packaged 3rd Party GIS Plugins"


    Refer to a previous article on GIS Desktop Customization to learn about manipulating buttons/tools and toolbars on your GIS interface.

    Tuesday, April 20, 2010

    GIS Desktop Customization

    I developed and led a training seminar for FDEP's ArcDiscovery Sessions that discusses GIS Desktop customization.  Presented April 15, 2010 to 30 in-house participants and another 20 employees around the state via video conference, this topic is separated into two parts:
    • the configuration of buttons and toolbars on the ArcMap interface
    • an introduction to object-oriented programming for custom GIS tools

    Below are the slides that were presented in the course, however a pdf tutorial accompanies the talk which provides step-by-step instruction on each topic discussed in the seminar.


    Monday, April 5, 2010

    Geometric Field Calculations

    There are a number of common geometric field calculations that I use on a regular basis.  Calculating polygon area & primiter, linear/arc/path distance, or feature centroid coordinates are surprisingly simple to obtain and can prove to be very powerful information.

    If you're working in a geodatabase, many of these will be automatically calculated and updated as features are edited, however these must be re-calculated using the Field Calculator when working with shapefiles.  Here's how:
    • Open a layer's attribute table
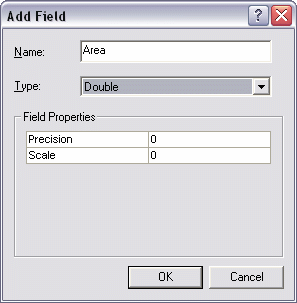
    • From the Options menu at the bottom of the attribute table window choose Add Field... if some kind of area/length/etc. field does not already exist.  
    • Name the new field and choose Double for its type.

      Again, if the layer is in a geodatabase, the SHAPE_AREA and SHAPE_LENGTH fields will be available and updated.  These fields will be present in a shapefile format if they were exported from a geodatabase coverage, but you will need to re-calculate the values.  Don't bother adding a new field if this is the case - just update the existing fields using the following steps
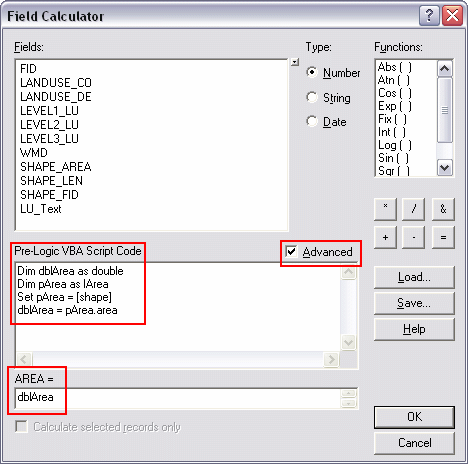
    • Right click on the appropriate field (of type Double) and choose Field Calculator
    • Check the Advanced option box
    •  Use the following code snippets to calculate the appropriate type of geometric information for each feature.  I'll calculate polygon Area for this example, however I can also calculate perimeter or centroids, etc.

      Paste the code (see below) in the Pre-Logic VBA Script Code box, and type the object (the variable that is created in the first line: in this case it's dblArea) in bottom most text box.  Click OK when finished
    •  That's it!
    Below are code snippets for various types of geometric calculations.  Be sure to paste the corresponding object created in the first line (dblArea/dblPerimeter/etc.) into the text box at the bottom of the Field Calculator.

    Area
    Dim dblArea as Double
    Dim pArea as IArea
    Set pArea = [shape]
    dblArea = pArea.area


    Perimeter
    Dim dblPerimeter as Double
    Dim pCurve as ICurve
    Set pCurve = [shape]
    dblPerimeter = pCurve.Length


    Length
    Dim dblLength as Double
    Dim pCurve as ICurve
    Set pCurve = [shape]
    dblLength = pCurve.Length


    X-coordinate of a point
    Dim dblX As Double
    Dim pPoint As IPoint
    Set pPoint = [Shape]
    dblX = pPoint.X


    Y-coordinate of a point
    Dim dblY As Double
    Dim pPoint As IPoint
    Set pPoint = [Shape]
    dblY = pPoint.Y


    X-coordinate of a polygon centroid
    Dim dblX As Double
    Dim pArea As IArea
    Set pArea = [Shape]
    dblX = pArea.Centroid.X


    Y-coordinate of a polygon centroid
    Dim dblY As Double
    Dim pArea As IArea
    Set pArea = [Shape]
    dblY = pArea.Centroid.Y


    Read more in these selected ESRI's articles:
     - Making Field Calculations
     - The Field Calculator Unleashed

    Sunday, February 7, 2010

    Challenges of February Album Writing Month


    February Album Writing Month is a challenge to write and record 14 songs in 28 days.  This is quite a feat in itself, however the collective of artists with whom I have joined live hundreds of miles apart!  The solution is a (so far) effective integration of web technology, project management, discussion, collaboration.  Somehow, we have found enough time to cram some creativity in there.

    Discussion and Collaboration:
    E-mail is the main form of communication however many of the members meet in a group chat session to discuss various topics ranging from media about material to management techniques.  These are assisted by the use of a private Google Group, which we use to group e-mail topics and discussions together, an also to store web pages to jot down notes, lyrics, and other information about songs, and other information.


    Project Management:
    The Google Group is a very important tool to keep ideas flowing together smoothly, however key bits of information can get easily lost in this massive amount of flowing thoughts; especially if a member misses a message, or cannot keep up to date with every discussion.  A more specific collaborative table of information was created using a Google Docs spreadsheet to track the process of individual songs that are in various stages of being created.  Take a look below:


    Web Technology:
    Many thanks are given to Google for providing such power and effective tools, however there's still more to this endeavor.  The nature of internet recording projects introduces a problem of sending content (numerous large .wav files).  We have been using a private FTP site to house the final cuts of each contributing part of a song to be mixed at the end of the month, however drop.io is used to post intermediate audio tracks (loops, samples, ideas, grooves, individual cuts, etc.) to quickly reference for writing and recording sessions:


    In addition, several members are posting thoughts and musings about the process in our blog: TheseGnarlyBeasts.tumblr.com.  As the recording for each song is completed, we intend to post minute-long raw mixdown samples here.  The final album will be released free of charge via bandcamp (also see TheseGnarlyBeasts.bandcamp.com):


    I have been streaming my recording sessions live on the web via justin.tv/justinberke.  Each time I start a session, I post a link to my friends via Twitter & Facebook, and justin.tv automatically posts a bulletin on MySpace.  This allows any of my friends, or other fellow Beasts to tune in and check out how each drum track or other portion of recording/mixing is progressing.

    These Gnarly Beasts draw upon a plethora of technological advancements to assist in making this daunting challenge possible.  A combined management effort from all members ensures that these various tools work effectively to facilitate a continuous flow of creativity and collaboration all month long.  Look for an additional link to the full album in the first week of March.

    Saturday, December 19, 2009

    Quick Zoom Tools


    Download the icons & code package:
    Custom Zoom Tools.zip

    The Bookmarks feature in ArcMap is great for navigating to a saved view, composed of a specific location and scale in a mapping project, however I'm working on a project where I want to zoom to a predefined map scale (1:5,000, 1:30,000, or 1:100,000), but I do not want to change the location.  In this case, Bookmarks are not the answer, so I built three buttons that change the Map Scale with a single click.

    Having this single click option saves up to a couple seconds of looking for an appropriate scale each time a button is used instead of scrolling, switching to the Zoom In/Out tools, or typing a scale unit manually.  It would be much faster (especially over the time span of an editing project) to use "map scale bookmarks" to automatically zoom to a predefined level.

    Three specific scales are chosen to represent three general views:
    • 1:5,000 is a decent large-scale to use for detailed neighborhood-level observations and to zoom in close enough to get a good look at braided stream segments
    • 1:30,000 is an effective medium-scale to use for viewing larger areas, while the user is still able to distinguish smaller anomalies in a coverage or in imagery
    • 1:100,000 offers a much larger visible area.  For projects that stretch over wide areas, this map scale offers a quick step back to pan across the city/county, etc.
    Remember, in cartography "large-scale" refers to larger quotients which are less than, but approach the one.  So as the denominator decreases, scale increases:
    • 1:5,000 = "One-to-five thousand" = 1/5,000 = "One divided by five thousand" = 0.0002
    • Similarily, 1:30,000 = 0.00003
    • 0.0002 > 0.00003, thus 1:5,000 is a larger scale than 1:30,000
    • Further, 1:1 = 1.0, and 1:2 = 0.5, thus 1:1: is larger than 1:2

    Installation:
    • Download and unzip the installation package, containing three bitmap icons, and a text file containing the code: Custom Zoom Tools.zip
    • Move the three bitmap files to C:\Program Files\ArcGIS\Bin\Icons or C:\arcgis\Bin\Icons (depending on your installation)
    • Open the text file Custom Zoom Tools Code.txt. Select All and Copy the text.
    • Open ArcMap and load either a saved project or a blank document
    • From the Tools menu, choose Customize.  
    • Navigate to the bottom of the Categories list and select
      [ UIControls ]
    • Make sure that the Save In menu at the bottom left of the Customize dialog is set to Normal.mxt
    • Press the New UIControl button and Create a UIButtonControl.  Repeat this two more times so the Commands list has three new UIButtonControls

      • Slow double click on each of the new button controls in the Commands list to rename them Zoom5k, Zoom10k, and Zoom100k.  The names will automatically change to Normal.Zoom5k, etc. when finished.  The names of these are important and must match exactally to work with the code.
      • Drag these three new button controls onto a desired toolbar (I put mine next to the Map Scale box)
      • With the Customize dialog still open, right click on each button and navigate to Change Button Image :: Browse.  Choose the appropriate icon ("_Zoom5k" etc.) for each button
      • Close the Customize dialog
      Now just paste the code in the correct spot to finish:
      • Open the Visual Basic Editor by pressing Alt + F11, or by navigating to Tools :: Macros :: Visual Basic Editor
      • In the Project Explorer pane, expand "Normal (Normal.mxt)," and "ArcMap Objects" and double click on ThisDocument.

      • A window will open named "Normal.mxt - ThisDocument (Code)."   Scroll to the bottom of this text, add a few lines by hitting enter a few times, and paste all of the code from the text file included in the download above
      • Save this document of code, close the Visual Basic Editor and test the buttons.

      The Code:
      In the following example a few elements are prepared to change the map scale, the map scale is set to 1:5000 (pMap.MapScale = 5000), and the map is refreshed so the new map scale will be visible to the user:

      Private Sub Zoom5k_Click()
      'Change the scale of the current view to 1:5,000

      Dim pMxDocument As IMxDocument
      Dim pMaps As IMaps
      Dim
      pMap As IMap 
      Set pMxDocument = ThisDocument
      Set pMaps = pMxDocument.Maps
      Set pMap = pMxDocument.FocusMap
      pMap.DistanceUnits = esriUnits.esriInches

      pMap.MapScale = 5000

      pMxDocument.ActiveView.Refresh 

      End Sub