Tuesday, November 8, 2011

Changing a high pressure hose on a scuba regulator rig

There's really not much to switching out hoses on a scuba regulator rig, but there are a few differences between high pressure and low pressure hoses.
  • Low pressure hoses have a general working pressure of around 140 psi; much lower than the pressure contained in the cylinder.  The ends are almost as wide as the hose itself to allow gas to flow through it easily.
Wide hole of a low pressure hose

  • High pressure hoses have a working pressure that is equal to the compressed gas in the cylinder so a diver can constantly monitor how much compressed gas remains on a dive.  There is a very small hole on the end of the hose that connects to the first stage regulator.  In case of failure, a stream of gas at 3000 psi will be released, however it will only be in a tiny stream so it will take far longer to deplete the cylinder of all compressed gas.
Changing the hose:
  • To change a rig's high pressure hose that connects the submersible pressure gage (SPG), turn over the console (if applicable) and remove the plastic protector cover from the back of the rubber housing.  This will allow you to bend the rubber console and push the gage out of the unit.

  • Bend the rubber console while gently pushing on the back of the gage.  
  • Use two wrenches to loosen the nut, then continue to unscrew the nut to remove the SPG from the hose.
  •  Back the old hose out of the rubber console.
  • Now you will be left with the gage, the "swivel spool" which is the o-ring hardware that allows the gage/console to rotate at the end of the hose, and the high pressure hose itself.  The swivel spool will remain in either the SPG or the hose, so use pliers to gently remove the piece.  Do not let any dust, hair, etc. to stick to the lubricated piece.

  • Feed the new hose through the console, replace the swivel spool in the SPG, then attach the SPG to the end of the high pressure hose and tighten.
  • Pull the hose back through the console and fit the gage snugly into place.  This may take a few minutes.  Do not use too much force or pull too hard on the hose.  A bit of wiggling should suffice.

Read more:
http://www.divegearexpress.com/regulators/hoses.shtml

Friday, August 12, 2011

Connect to ArcMap layers and tables with VBA

Example description:
I am editing a coverage of stream segments (lines) and would like to log any updates to a non-spatial, standalone table in the geodatabase so I can keep track of the evolution of the dataset over time.  The application will first need to know which datasets to edit, so I start by adding  two combo boxes to the form that will be automatically populated with the two necessary types of data, named cboFlowingWatersLayer, and cboFlowingWatersUpdateTable, respectively.


The first combo box will allow me to select any of the the spatial datasets (geodatabase coverages/feature classes/shapefiles/projected datasets/etc.) that are available in the Table of Contents pane:

Map layers in an active ArcMap project

The second combo box will select the non-spatial, standalone table (highlighted below) that is otherwise available under the Source tab in the Table of Contents pane.  There are two additional dummy tables that I added to this project that are not visible in the screenshot below, but you'll see them later.

Non-spatial tables in an ArcMap project

Coding:
I add some code to populate the combo boxes with any available layers or standalone tables when the form activates.  There's a brief Setup section, then an If/Then statement will check to see if there is a layer already set in there.  If not, it'll clear it and populate the control with any spatial layers that are available.  If there is anything in there, it will run a separate function to check if it's the right layer.  I won't address that procedure here, so it's commented out below (though I recommend adding such a function). Let's get started with filling in the names of just the spatial datasets first:

Private Sub UserForm_Activeate()
'Setup
  Dim pMxDoc As IMxDocument
  Dim pMap As IMap

  Set pMxDoc = ThisDocument
 
Set pMap = pMxDoc.FocusMap

'Populate the first combo box with any available spatial
' layers that will show up in the Display tab in the
' ArcMap Table of Contents pane
  Dim i As Integer
  If cboFlowingWatersLayer.ListCount = 0 Then
      cboFlowingWatersLayer.Clear
      For i = 0 To pMap.LayerCount - 1
          Me.cboFlowingWatersLayer.Additem (pMap.Layer(i).Name)
      Next i
  Else
      'Call Me.FlowingWatersLayerCheck
  End If

End Sub

What should appear when the first combo box is selected are any layers that are available the Display tab of an ArcMap project.


(Note that apps can only work with shapefiles, geodatabase coverages, etc. and not groups of data.  Data groups appear in this example as individual layers, but since they are not really spatial datasets, selecting them will cause an error at run time if they are selected and processed.)

Next we'll add some more code to add any standalone tables that are in the project using the IStandaloneTableCollection interface:

Private Sub UserForm_Activeate()
'Setup
  Dim pMxDoc As IMxDocument
  Dim pMap As IMap
  Dim pSATCollection As IStandaloneTableCollection 

  Set pMxDoc = ThisDocument
 
Set pMap = pMxDoc.FocusMap
 
Set pSATCollection = pMxDoc.FocusMap

'Populate the first combo box with any available spatial
' layers that will show up in the Display tab in the
' ArcMap Table of Contents pane
  Dim i As Integer
  If cboFlowingWatersLayer.ListCount = 0 Then
      cboFlowingWatersLayer.Clear
      For i = 0 To pMap.LayerCount - 1
          Me.cboFlowingWatersLayer.Additem (pMap.Layer(i).Name)
      Next i
  Else
      'Call Me.FlowingWatersLayerCheck
  End If

'Populate the second combo box with any available non-spatial
' tables that will show up in the Source tab in the
' ArcMap Table of Contents pane
  Dim j As Integer
  If cboFlowingWatersUpdateTable.ListCount = 0 Then
      cboFlowingWatersUpdateTable.Clear
      For j = 0 To pSATCollection.StandaloneTableCount - 1
          Me.cboFlowingWatersUpdateTable.Additem _
              (pSATCollection.StandaloneTable(j).Name)
      Next j
  Else
      'Call Me.FlowingWatersTableCheck
  End If

End Sub

Finally, this is what the second combo box will look like (with the additional two dummy datasets that were hidden from view in the screenshot above - they're named "Delete - Test 1" and "Delete - Test 2"):


Referencing the selected layer/table:
There are a virtually unlimited number of uses for mapping layers like this.  The idea is that the method above provides a heads-up interface to access the position of a given layer or table in the Table of Contents.  Think of the position as the dataset's number in line, starting at 0 instead of 1.  Take the five spatial "layers" that are available for example:

Place in lineVB Position #Layer Name
1st / Top
2nd
3rd
4th
5th / Bottom
0
1
2
3
4
"FlowingWaters layer"
"New Group Layer"
"Florida NHD"
"SWFWMD_draft_primary_canals"
"Reporting Units"

Whenever you need to use a specific layer, the interface we built above will allow a quick way for Visual Basic to reference the position number of a selected layer.  Of course you will need some error checking and handling code to ensure that the layer position isn't changed (adding, removing, or moving the order of layers in the Table of Contents will affect each layer's position number).

The following are a few examples on how to reference a layer's position number using the interface that we built above.

Example 1 - Connect to a dataset:
A working example follows, so don't worry about the function of the code yet.  This simply illustrates the structure of references needed to connect to a dataset.

The previous sections explain that an ArcMap project is made of up layers and sometimes non-spatial tables.  Further, those layers and tables have position numbers associated with them that are usually just unimportant background information.  Well, now we will use those position numbers to tell a program where to target its procedures.

After we choose a layer from the program interface, that combo box/pull down menu will store our selection as a number, which it refers to as its ListIndex.  Now if we want to know which layer or table we chose, we'll call it by referencing cboFlowingWatersLayer.ListIndex.

In the example below, we are instantiating a new variable based off of the IFeatureLayer interface (again, don't worry about what's happening yet).  We will set that new variable, named pFeatureLayer, equal to a specific layer number (position number) in an ArcMap project so we can do some more work on it later.  Just pay attention to the way that the combo box position is referenced:

Dim pMxDoc As IMxDocument 'Whatever
Dim pFeatureLayer As IFeatureClass 'Slightly Important
'...more code

Set pMxDoc = ThisDocument 'Still not the point
'Oh, here we go!
Set pFeatureLayer = _
  pMxDoc.FocusMap.Layer(cboFlowingWatersLayer.ListIndex)
'...more code


Ok! This essentially told the function/sub routine that:
  1. We're working with this project (aka ThisDocument)
  2. We're looking for a specific feature layer (spatial dataset/shapefile/geodatabase coverage/etc.)
  3. That dataset of interest will be in a certain position when you focus the map; and that position number can be found by A) looking at the combo box (pull down menu named cboFlowingWatersLayer) and B) pulling its current ListIndex value.
Got it.  Let's move on to a working example.

Example 2 - Count the selected spatial features:
Add two command buttons to the form, named cboLayerCount & cboTableCount, and change their captions to match the screenshot below

Added two command buttons

When a user clicks on one of these buttons, a message box will report how many records are selected in a layer or a table.  I'll add a quick error check at the beginning to make sure that a layer has been selected.  If a layer has not been selected yet, the ListIndex value will be -1. Here's the code:


Private Sub cmdLayerCount_Click()
'Error Checking
  If cboFlowingWatersLayer.ListIndex = -1 Then
      MsgBox "Please choose a layer to count."
      Exit Sub
  End If

'Setup
  Dim pMxDoc As IMxDocument
  Dim pMap As IMap
  Dim pFS As IFeatureSelection
  Dim pSelectedFeatures As ISelectionSet

  Set pMxDoc = ThisDocument
  Set pMap = pMxDoc.FocusMap
  Set pFS = pMap.Layer(cboFlowingWatersLayer.ListIndex)
  Set pSelectedFeatures = pFS.SelectionSet 

'Display a message box to report info
  If pSelectedFeatures.Count = 1 Then
    MsgBox "There is 1 feature selected."
  Else
    MsgBox "There are " & pSelectedFeatures.Count & _
        " features selected."
  End If

End Sub

Save this, run the code, select a few features and you should get something like this:


Example 3 - Count the selected standalone table features
Using the same GUI (graphic user interface) that was built in the previous example, apply the following code to the "Table Count" command button to count the number of selected records in a standalone table.  A very similar method will be used for this procedure, however we will need to use the ITableSelection inteface in place of the IFeatureSelection interface since we're working with a standalone table instead of a spatial dataset.  Further, I won't need to sort through any of the selected features in the standalone table in my larger project, so I'll leave out the Selection Set and count directly from my Table Selection:

Private Sub cmdTableCount_Click()
'Error Checking
  If cboFlowingWatersUpdateTable.ListIndex = -1 Then
      MsgBox "Please choose a layer to count."
      Exit Sub
  End If

'Setup
  Dim pMxDoc As IMxDocument
  Dim pSATCollection As IStandAloneTableCollection
  Dim pTS As ITableSelection

  Set pMxDoc = ThisDocument
  Set pSATCollection = pMxDoc.FocusMap
'This next bit must be on the a single line;
'  the format of this blog makes coding difficult.
  Set pTS = pSATCollection.StandaloneTable(
       cboFlowingWatersUpdateTable.ListIndex)

'Display a message box to report info
  If pTS.SelectionSet.Count = 1 Then  
      MsgBox "There is 1 feature selected."
  Else 
      MsgBox "There are " & pTS.SelectionSet.Count & _
          " features selected."
  End If

End Sub

Now, after you map a standalone table in the Flowing Waters Update Table combo box and click the Table Count command button, you will be able to count any selected records in the table, just like you would count the records in a spatial layer.


Friday, June 24, 2011

PivotTables Example: Reducing Multiple Records for One Site

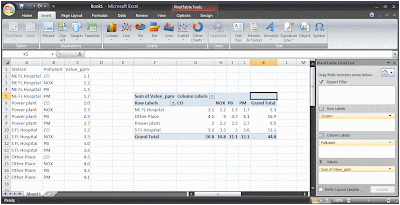
Click to enlarge: Example dataset and completed PivotTable
There is a dataset that has unique records for various pollutants for a number of locations across the state.  Thus, there are multiple instances of the same station for each of the four pollutants in this abbreviated example: CO, NOx, PB, and PM (etc.).  I gave each of these records imitation data in the Value_ppm field to illustrate how the data are moved after being manipulated by the PivotTable process.  The values for the first station group are 1.x, the second group are 2.x, etc.

Process:
  • Open a dataset in Excel (2007) - though this is largely available in previous versions of Excel.
  • From the Insert tab choose Pivot Table
 
  • From the Create PivotTable dialog, select all of your important data (including field headings), and choose to place the new table in a New Worksheet
  • From the PivotTable wizard that will likely appear docked to the right side of the Excel window, click the menu button at the top and choose "Fields Selection and Areas Stacked" option
 

  • Select the fields you wish to be included in your final dataset.  I picked all three from my dummy dataset
 
  • Select the menu button again at the top of the PivotTable wizard and choose “Areas Section Only (1 by 4)”
  • Now drag the fields into the following order:
    - Row Lables: Station (or station name/id)
    - Column Labels: Pollutant
    - Values: Sum of Value_PPM
 
  • Remove the "Grand Total" fields by right clicking on the new table and choosing PivotTable Options
  • From the Totals & Filters tab, uncheck the first two boxes under Grand Totals and click OK
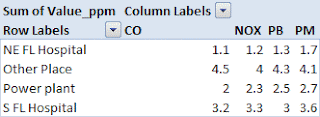
Final Table
  •  Finally, Copy and Paste the raw field headings and data to a new, final worksheet.  From here, if you are dealing with spatial data, I suggest joining Lat/Long/Datum information to the Station in Access or ArcMap/Catalog
Additional Grouping Fields:
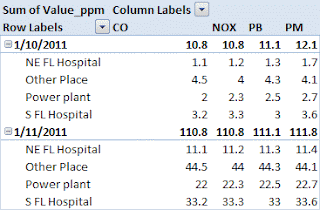
Your dataset will be a bit more difficult if you need to attach additional information included as a grouping parameter, such as an observation date.  You can start by adding the Date column (switch back to the “Fields Selection and Areas Stacked” view) to the Row Labels area of the Pivot Table wizard.  Make sure Date is first, followed by Station.

Further grouping by Date
  • If this last table is useful, you may want to remove the group subtotals before you copy the raw data into a new worksheet.  Simply right click on a Date cell inside the newly created table and uncheck the Subtotal "Date" option

Monday, June 13, 2011

Running Line in a Cave

Here's my first shot at an illustration of running line from open water into an overhead environment such as a cavern or cave.

[Click to enlarge]

I suggest practicing in open water or even on land so you won't have to worry about holding a flash light on your knot (though it's much easier to run line in water; the line won't fall to the ground as quickly because it will be suspended better in the water column.).  Run a course around a spring basin where there will usually be plenty of large rocks and tree branches to use as tie-off points.

Here's a video example.  Watch at 0:40 and 1:10 for this technique.  The only difference is that the diver does not wrap the line back around a couple times - but that is not always necessary if the spot is secure.


Things to consider:

  • Another technique is to wrap first, then pull the tension from the incoming line last.  This will help keep tension on your line between tie-offs, however I like to pull the tension first to shore up previous segments.  Practice on your own and use whatever works best for you and  the situations you regularly face.
  • Running the reel close to the floor of a cave/cavern can easily stir up the bottom, or even cause a silt-out.  Try making a loop with the line and fixing the loop around the rock or spur without moving the reel through the sediment.  Watch the video above from 3:38 to 3:56 for an example of how to do this.  Simply make a loop, attach the loop to a good spot, and pull tight.  The diver above makes two loops before pulling to secure the loops.
  • Not all tie-off locations can actually be tied.  Often turning a corner around a large rock or other firm piece of debris will be a sufficient way to secure line as long as there is enough tension on the line.  This can serve as an intermediate spot between two tie-offs.  Further, if there are only loose rocks (football-basketball sized) available, don't bother wrapping.  Just lay your line and put a rock on top of it to hold it down.  It's easy for a line to become unwrapped, thus losing tension, and this will also conserve some line as well.

Monday, April 18, 2011

Admin Privileges: You need 'em

There are indeed worse interruptions to encounter during a productive working session than meeting that little error message that tells you that something has been denied because you do not have administrative privileges.  Still, it's an annoying little splinter that reminds you that you're not allowed to use your workstation.  This can range from opening clock on your task bar to quickly view the calendar in Windows Date and Time Properties to installing software.

If you're using ArcGIS, or any other GIS software for that matter, you need administrator privileges on your machine.  Here are a few reasons why:

ArcMap has a lot of advanced technical settings that can be changed to make the software work more efficiently for yourself or a specific project.  Many of these control the way the software interacts with your computer, so the settings are saved in the registry.  Registry keys are very sensitive and a lot can go wrong with just a little tweaking, so these are often off limits to non-admins.  Such settings can be found in the ArcMap Advanced Settings utility in the following directory:

<ArcGISHOME> \Utilities\AdvancedArcMapSettings.exe
(<ArcGISHOME> = C:\arcgis, or C:\Program Files\ArcGIS, etc.)


Further, there are a number of third party software utilities that are light, benign, and VERY HELPFUL when you're still learning your way around geoprocessing procedures.  ETGeoWizards is a great free package that has helped me through some projects.  There are dozens of processes that are very well organized.  Nine thumbs up.  XTools is another package that (I'm pretty sure) requires admin privileges to install.

Screenshot of ETGeoWizards for ArcMap

There are a hand full of other reasons why you should have access to your workstation, but these should suffice for now.


Update: 4/18/2011:
I received a request to justify administrative rights on my machine.  Here's my request:

"It is necessity for my workstation to continue to utilize administrative privileges due to the nature in which GIS software is used on a daily basis on my machine here at FDEP. ArcGIS has a number of advanced properties that often need to be managed by altering various registry settings for the software package. Further, I will be using Microsoft’s Visual Studio .NET to author, test, and install a number of custom applications to use in conjunction with the ArcGIS interface. The usefulness of many of these customizations and other third party plug-ins require administrative privileges to work effectively."
Update: 5/10/2011:
Another instance of ArcMap Advanced Settings that require Admin privileges:

I'm editing a large statewide network of streams and just populated a new field of unique identifiers.  Upon saving these calculations, I received an error message reading, "Unable to save edits. File sharing lock count exceeded.  Increase MaxLocksPerFile registry entry."

This value can easily be changed via ArcMap Advanced Settings, under the Editor tab.  However this changes a value in the system registry (there is even a warning next to this setting in the application), so changing this setting -- among other similar tasks -- requires admin privileges.

Friday, April 1, 2011

Alternating Rounded Corners on Graphic Elements

I like legends that blend in with the neatline of a map but if there are disconnected graphical elements with rounded corners then a sharp corner will not match.

The solution is as simple as aligning graphical elements (drawing various shapes) and applying a Union process to make a single shape.

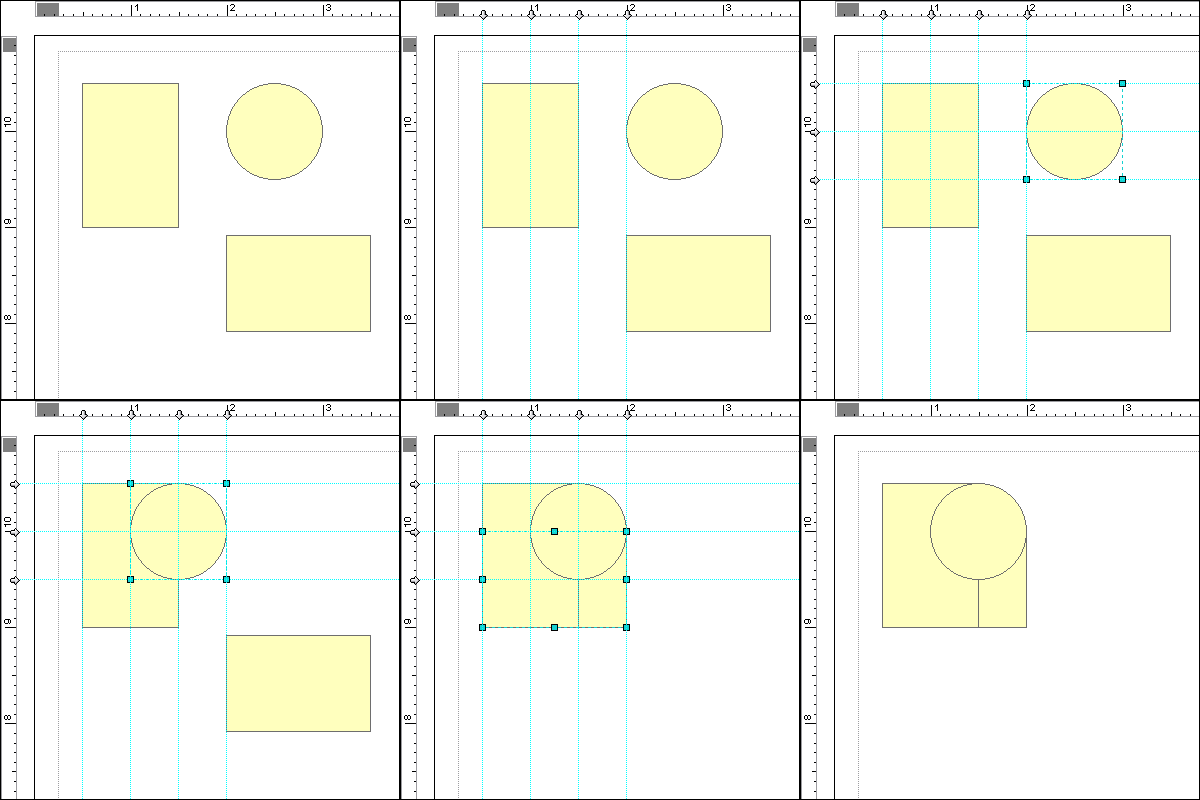
  • Begin by adding two Rectangle elements and either a Circle or an Ellipse element (holding Ctrl while dragging the boundary of an ellipse will create a circle by keeping the aspect ratio of the width and height equal; the same goes for drawing a square with the Rectangle tool) to the Layout view of an ArcMap project
Add two Rectangles and a Circle
  • Align the top of the circle with the tall rectangle and the right side of the circle with the wide rectangle.  This can be done by either using ruler guides or by selecting two objects and using alignment tools that may be on a toolbar, or by right clicking on the selected objects and choosing an alignment method from the Align sub-menu.
  • Once the objects are aligned, select all three elements, right click on them and navigate to the Graphic Operations menu, and choose Union to blend all three objects together into a single element
From this point one can scale the curve smaller, use smaller circles to create sharper corners or ellipses for more gradually curving ellipses, combine these elements with others, or use other Graphic Operations to create more advanced features (Intersect , Subtract ); some even with negative space (Remove Overlap).

The following is a quick example of a few of these methods.  The inset title box was flipped horizontally, and a couple of additional boxes were Unioned to extend the space for the scale bar.  The north arrow box was simply a circle with three quarters Subtracted from a digitized polygon.  Guides assisted the alignment for clean and even corners.

Note: Since these are vector graphics, the elements can be easily scaled with a clean look.  In some cases, however, if the shapes are not aligned together precisely, distortions can occur where two elements were joined together.

Friday, January 14, 2011

Java Introduction / Cheat Sheet

› I will continue to add to this article over the coming weeks.
Setup:
You'll need to download and install two things to get started coding:
  • Java SE 6 JDK (Java Platform, Standard Edition 6 Development Kit)
    - Choose your operating system and platform and download the JDK version, not the JRE (only the runtime environment)
  • Eclipse IDE (Integrated Development Environment)
    This is the interface through which you will be programming, compiling, and running and testing code


Hello world:
This simple program will output the text, "Hello, World!" (without quotes).

The program is composed of a class definition named HelloWorld.  The HelloWorld class runs from the first opening brace ({) to the last closing brace (}).  All Java programs use class definitions.

The next portion of code sets up the main method.  Methods define the operations that an object or program will perform.  The code in a method lives inside another set of braces ({}) In this case, the program is simply printing a line that says "Hello, World!" using the println (print line) method of the out object, which is stored in Java's predefined System class.
public class HelloWorld
{
    public static void main (String[] args)
    }
      System.out.println ("Hello, World!");
    }
}
That's it! This Java program contains just three simple steps:
  • Define a class named HelloWorld.  Its code is included between two braces
  • Define a method named main that has a few settings that aren't really important to know about yet, but can be explained a bit further in this Java tutorial.  The code between the method's braces will be instructions to be performed by the program
  • Call the println method from the System class's out object to write "Hello, World!" as output.  This instruction is ended with a semicolon (;)

Comments:
Comments are an efficient and important way to provide documentation and insight as to what your program is doing at any given point in the code.  Be sure to include detailed descriptions to help you or another programmer when returning to review or revise the code at a later time.


// Single-line comment

// This can be attached after some code on a line.
// Anything after these slashes on the same line 
//   will be omitted

/* A comment spanning several lines:
EVERYTHING between these comment marks will
be omitted by the Java interpreter */


Variables & Constants:
Variables and constants are places in code to store information for the program to use and reference.  Variables are dynamic; in that once they are created they can remain blank or equal to zero, or they can hold text or numeric information or be set to true or false.  Examples include any kind user provided data, an e-mail address, age, phone number, number of stars given on a restaurant or movie review, a program iteration number, amount of records in a database, etc.  Further, they can be changed at any time, or erased and set back to their original "blank" or "null" state.

Constants, on the other hand, can also hold data, though these will be set once when the program begins and will remain the same throughout the program's life.  Examples include the number pi, thresholds (1 millionth customer at a store, the upper limit of $1.00 on the Price is Right Showcase Showdown), freezing/boiling points of water in °F/°C/°K, etc.

Identifiers: are variables, constants, reserve words, etc.
  • Alphanumeric, underscores (_),  and dollar signs ($)
  • Case sensitive
  • Can be any length
  • Must not begin with a number
Acceptable:
int_Value, String3, $LakeSize, _StreamSize, $100, a_very_long_stupid_string_that_should_be_shortened

Unacceptable:
int-Value, 3rdString, Lake Size, _Stream#Size...


Escape Sequences:
This is a list of special characters that can be used in a program which would otherwise cause a compile-time, run-time, or logic error if entered directly.  For instance, entering """ (a string containing a double quote character) will cause a compile-time error because the the middle quotation mark will be interpreted as the end of a blank string.  Instead the code would need to be entered as "\"".

SequenceOutput
\bbackspace
\ttab
\nnewline
\rcarriage return
\"double quote
\'single quote
\\backslash

Conditional Operators:

Equality / Relational
OperatorValue
==equal to
!=not equal to
<less than
<=less than or equal to
>greater than
>=greater than or equal to


Logical
OperatorValueUse
!NOT! a
&&ANDx && y
||ORx || y


Resources:
Java Foundations, 2nd Edition
John Lewis, et. al


Monday, January 3, 2011

Remove Cryptic Folders in XP


I've seen a lot of these weird, cryptic folders appearing on the root of my Windows XP machine for a while but never knew what to do with them.  I had data "Ghosted" over from a previous hard drive that had a mechanical failure, and most of these appeared after the recovery.  These are all seemingly random combinations of letters and numbers between 20 and 30 characters long on the root of my master hard drive (C:\).

Reading a few forums/technical documents gave me the impression that these are temporary directories and files that are left over from updates that have occurred in the past.  These should have been automatically removed, but they are often left behind.  Other users in my office have a couple of such folders laying around, and my computers at home have one or two as well, although my work machine has a couple dozen, which take up almost 3 GB of hard drive space!  As far as I can tell, these left over, benign files can and should be removed.

Attempting to delete any of these folders simply return security/access errors, so I tried to delete them using Windows Explorer in Safe Mode.  No luck.  I then tried using a del command in Safe Mode's Command Prompt.  No luck either.

The trick is to set Delete permissions for the administrator/user.  It may help to be in Safe Mode, but I was able to delete some without being in Safe Mode.  My account also has Administrative privileges, so that is more likely necessary.

The following are two methods for removing these data.  "Individually" contains the method that illustrates how to access the specific setting that is restricting these files/directories from being deleted.  "En masse" is a faster method to delete all of these folders at once.

Remove Individually:
  •  Right click on a folder or a file and select Properties
  • Navigate to the Security tab and click the Advanced button toward the bottom of the dialog box
  • Highlight one entry at a time, starting with Administrators, and choose Edit (or just double click an entry to edit its permissions)
  • Scroll down and check the box to Allow this entity Delete permissions.  Remove any Deny permissions if that happens to be selected, but these boxes should be blank.  Click OK once to return to the "Advanced Security Settings for [Folder Name]" dialog
  • Repeat the previous two steps for teach additional entry in this list.  Others may include SYSTEM, CREATOR OWNER, Users [...], etc.
  • Now deleting the folder or file should not return any errors and the data can be deleted normally
Remove En Masse:
  • Select all cryptic folders.  Be sure not to include system/necessary program folders in this selection (see the graphic at the top of this article)
  • Right click and select Properties to open the properties for all directories
  • Click on the the Security tab.  You will be prompted with a Security warning
  • When prompted, choose Yes to reset security permissions for all selected folders
  • All permissions will now be reset to "Allow," specifically the Delete process
  • Now deleting the folders or files should not return any errors and the data can be deleted normally
Additional resources:
 - How to take ownership of a file or a folder in Windows XP