Friday, May 4, 2012

The "supermoon" is BS


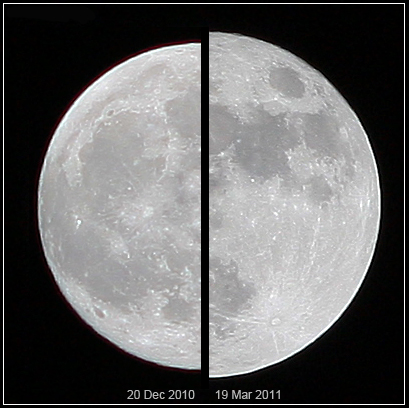
A supermoon is not visually, nor geophysically significant. Even the full size version of the image below is a very large magnification. To get the real effect of its significance, look at this thumbnail below from at least 15 feet away.
Average sized moon vs. "supermoon"
Click to enlarge
Any pictures you see this weekend or during any subsequent "supermoon" event (which are still beautiful and magnificant sights, don't get me wrong) will be nothing more than uninformed misinterpretations of the Moon illusion: where objects close to the horizon appear larger than it does further into the sky.
Check out @NeilTyson on Twitter
I'm glad people are interested in the world and universe around them, but it's being portrayed in an unacceptable, unscientific manor.

Thursday, May 3, 2012

Custom Scuba Diving Logs

Near the end of my first diving log book (≈100 dives), I started looking for for a new set of logs that would be a bit more advanced and provide enough space for the detailed descriptions of dives like I wanted to write.  Unfortunately I could only find log books that were unnecessarily complex (individual check boxes for wetsuit gloves, a full suit, shortie, jacket, how much weight was used, etc. - overkill)  I can see how that level of detail could be useful if you end  up only doing 10 dives in a lifetime, or for your first dozen dives, but that was ridiculous.

I ended up making my own and used them through cavern training with a lot of enjoyment, however I ended up losing the whole pack of logs (from dive #1 to Dive #154) due to some unknown event (likely slid off the top of my car or something terrible), so this is my second shot at creating advanced (enough) custom scuba diving logs.

Download: PNG (single) / PDF (print on 8.5" x 11" paper) / DOC (template to edit)

Updates:
Over time I will update the template to be the most clear, concise, and easy to use.  Here's a list of previous versions and their changes:

DateDownloadsDescription
August 1, 2012PNG / PDF / DOCAdded space for Equivalent Air Depth (EAD)
and Dive-turn time
May 13, 2012 PNG / PDF / DOCHighly updated draft uploaded. Print formatting
applied and formatted for advanced diving. Space
is provided on each page for 2-sided printing,
which leaves enough room for binding
July 19, 2011PNGOriginal basic dive log template

Overview: 
  • Printing: The PDF & DOC templates are setup for printing on standard 8.5" x 11" paper, which will give you 4 log spaces per sheet of paper (using a 2-sided printing option). A small margin has been set in case you choose to bind the logs at any point.  I recommend taking a stack of written logs to Office Depot, etc. to be bound with a coil binding.  Be sure to punch holes in a test page so your logs are not ruined. Add a clear plastic cover and a colored back to protect it.
Finished log: 25 pages bound with a ¼" coil binding
    25 sheets of paper (100 entries) fit very well into a ¼" coil binding, and at least twice as many fit into a ½" binding.  Since binding is so cheap ($5 to bind 25 pages with a clear front cover and a black rear cover), it may be worth binding smaller groups of logs and combining them as volumes later.  One could even replace the smaller coil with a larger one when additional groups o flogs are completed
  • Editing: Download the .DOC file, which was created using Microsoft Word 2003 & 2007. Much of the formatting includes tables with invisible borders.  It may help to select an area and apply borders to better understand how things are set up.  Additionally, custom cell padding is attained by adding blank lines of text with very small pixel values (1-4 pixels) above or below lines of text.  Use the Show Paragraph & Formatting Marks tool in Microsoft Word, etc. for further assistance.

    Finally, I suggest editing only the first of the four tables in the document.  Delete the remaining three tables from the document. Copy the updated table and paste it below (now 2 identical log entries will be present on one page) and align it to the bottom of the page.  Now copy the contents of the first page and past it onto page 2 (four log entries will be present on 2 pages).  Select one table at a time on page 2 and adjust the alignment to the left side of the page, leaving room for a binding on the correct side of the page; when these 2 pages are printed on a single sheet of paper, the borders should align if you gaze through the paper when help up to a light.
  •  Chronology: Write the dive number in increasing order for every new dive so it's easy to see how many dives have been completed.  The date follows.  I have two methods of recording how much time a diver has spent underwater: the first is the accrual of dive time in total hours/minutes, then again in days/hours/minutes (i.e. 25 hours 1 minute (25:01), or 1 day 0 hours 1 minute (1:00:01).  It's fun/interesting to track blocks of hours as milestones (dozens, hundreds of hours, etc.) while being able to quickly see each "day underwater" pass, as well as each block of hours pass.  Additionally, it serves as error checking - if a dive was miscalculated, simply calculate between hours and days until you find where they two figures no longer disagree
  •  Location: Enough room is provided to describe the location/sub location (i.e. Orange Grove Sink @ Peacock Springs State Park), along with a lat/long coordinate if a GPS is available
  •  Purpose: Self explanatory, check boxes
    • Dive type conditions: More simple check boxes are available to describe the dive, however there are now multiple opportunities to circle parameters of a given condition.  For instance, there was some flow during this Intro-level cave dive.  Otherwise, if this were an open water drift dive, "drift" would be circled instead.
      An Emergency option is also available.  I've logged this a few times where there was a situation that needed to be responded to (signs of a near-panicking diver, a diver that was caught in a slight rip current, divers were very low on gas at depth, etc.).  This is interesting to note, even if the "emergency" situation does not escalate into a serious event.
      Additionally, a user can track how many dives have been completed at various levels of overhead training: including Wreck penetration / Cavern / Intro Cave / Apprentice Cave / Full Cave.  This was my 19th cave dive, but I could also use the number that corresponds to another type of overhead diving (i.e. 7 Wreck penetrations, or 43 Cavern dives).
      Further, I have been jotting a small note about how much current (slight/med/strong) was present on a dive in the blank space
    Conditions, with multiple types of overhead diving, including:
    Wreck penetration / Cavern / Intro cave / Apprentice cave / Full Cave
    • Weather conditions: There is space to jot down the weather (hot/warm/chilly/windy/air temperature), water temperature (with space for two temperatures in case a thermocline is present), and visibility under water (here I put 40' to unlimited/infinite).
      Weather.gov is a good tool to use to find a 3 day history of temperatures and weather data for anywhere in the country.  For an example at Little River, use this link and look for the "3 Day History" link in the "Current Conditions" box. Pan around using the embedded Google map and click on an area of interest to update the forecast location.  Once you are centered over an area of interest, click on the "3 day history" link for that area to find your data.
    • Time: Include a time to assist with repetitive dive planning
    • Gear: Use check boxes and circle any gear or equipment that is used on a dive.
      I placed a check box to the RIGHT of the Reels item because I had two safety reels on me, however I did not run line and I did not run any lost line/lost buddy drills in the cave so I placed a check beside the item, indicating that they were present but not used.
      Additionally, a blank space is provided for unlisted items.  For instance I usually dive with a hood/beanie cap when I dive my wetsuit so I wouldn't bother noting that, though I rarely dive with gloves unless I'm on a deep wreck with an up-line, so I would likely include that in the blank space.
    • Tec parameters & O2 exposure: There is optional space to note a diver's Surface Air Consumption (SAC rate), Oxygen to Central Nervous System Exposure percentage, and Oxygen Tolerance Units (OTU) & Unit Pulmonary Toxic Dose (UPTD) units for advanced planning and decompression diving.  These information are usually reserved for decompression or repetitive dives with significant exposure to high concentrations of oxygen.
    • Repetitive dive profile: This is a slightly updated version of a basic repetitive dive profile diagram.  A diver can denote whether the profile will be a generally square dive strictly using tables, a multi-level dive, or a dive with a decompression stop.  Since a majority of the time was spent traveling to or from 93' (a true "bottom time" of 22 minutes, recorded in the Turn time) this single cave dive (with no Surface Interval Time calculated on either upper side of the profile) is treated as a multi-level dive and a repetitive group will not be calculated (in the circles at the top of the profile).
      Additionally for Nitrox divers, spaces are available for recording the Equivalent Air Depth (EAD) and the maximum partial pressure of oxygen (PO2) reached on the dive.

      • Gas Supplies: Breathing gas and cylinder information have been placed together, which just makes more sense from a data management standpoint.  The back gas, or primary gas source, has the option of reporting single or double cylinders, cylinder material, type/rated volume (reported in this example is a low pressure steel cylinder rated to 95 cubic feet (LP95), gas mix, and starting/ending pressures.

        Additionally, a decompression cylinder or a stage cylinder can be recorded.  There is blank space directly below these for additional cylinders that are used on a dive.
      • Comments / Diagrams: The remaining blank space is reserved for a description of the dive and other important details and information.  The grid is available to help sketch maps or illustrations of fish or other objects observed during the dive.  Often I'll just use the space for text if an illustration is not necessary.

      Example:
      Here is an example of a completed log for this example above (using the original template).
      Click to enlarge

      Tuesday, May 1, 2012

      Impossible Khan Academy Question

      KhanAcademy.org is very cool.  This Web site offers lessons and exercises on a wide variety of mathematics, science, and other subjects.  I am going through and playing with some exercises in hopes of honing my advanced statistics, trig, and calculus skills.

      I came across this scuba diving example that uses simple arithmetic to solve.  The math is correct, but the situation is virtually impossible:
      Daniel was scuba diving 28 meters below sea level when he spotted a beautiful fish below. To see the fish up close, Daniel dove 29 meters until he was level with the fish, staring into its eyes.
      Where was the fish relative to sea level?
      Answer: -57 meters

      57 METERS DEEP!? Really? That's 187 feet!  Let's convert this situation to imperial units and interpret what is more likely ocurring:

      Some BS open water diver isn't prepared for a deep dive and heads down to 92 feet on a ledge somewhere amazing for far too long time and gets narced out of his mind since he's breathing air instead of Nitrox.  In a hallucination he sees something and decides to dive another 95 deeper and immediately dies from running out of breathing gas.
      How deep was Derpo when he died?
      Answer: Derpo died at -187 feet

      The follow is my nerdy response when I reported a problem for this question:


      Greetings,

      Although the math is correct, there is a problem with the unrealistic units of depth that are chosen in this example.

      A basic recreational scuba diver - who would be interested in observing and following fish rather than performing industrial or scientific work - is generally limited to diving within 100 feet from the surface (≈30.5 meters).  Beyond this depth a number of physiological factors limit a dive without having highly technical training and gear; including nitrogen narcosis, oxygen toxicity, and an elevated risk of decompression illness.

      The question states that a diver finds a fish at 28 meters below the surface (92 feet), and descends another 29 meters (95 feet) below this, giving a maximum dive depth of 187 feet.  This diver will surely suffer narcotic effects from the high partial pressure of nitrogen unless he or she were to switch to an anoxic breathing gas that is a specific mixture of oxygen, nitrogen, and helium (referred to as "heliox" or "trimix") which cannot otherwise sustain life at the surface.

      Beyond physiological limitations, it is technically plausible however unlikely that a diver will encounter conditions where visibility beyond 80-90 feet of vertical visibility.  In the case that a diver could view an object that lies an additional 95 feet below in the water column with any definition, it is unlikely that the object will appear to be anything more than a dark shadow, as water quickly absorbs much of the visible light spectrum.

      Without significant and expert dive planning in perfect conditions, this description of a scuba dive is virtually impossible.  Simply switching the units of depth from meters to feet would make this a far more plausible, and realistic example.

      Best regards,
       - Derpington

      Saturday, April 21, 2012

      HTML <button> vs <input type="button">

      <form name="frmTestingButtonTypes">
       <button>This is a button</button><br />
       <!-- Vs. -->
       <input type="button" value="This is a button">
      </form>

      HTML allows a developer to use JavaScripts to run custom functions and calculations in a simple, universal web interface.  This can be accomplished with only a little bit of experience with JavaScripting (and with some excellent guidance from w3schools.com).

      A problem I ran into recently (having plenty of HTML experience, and stolen only enough JavaScript code over the years to hack through and get by) was with some scuba calculators I recently began developing as HTML forms like this one:

      JavaScript scuba calculator utilizing onUpdate events

      I decided to omit a submit/command button and instead use onUpdate events to call the calculations so a user can convert from depth to pressure, or change the pressure and convert back to depth.  Also, this way is just cooler.

      The problem is that by adding name attributes in a <button> element inside of a <form>, the web page will want to reference any text boxes/drop down menus/check boxes/command buttons/etc. explicitly; so it will pass their values to the URL when any of those elements are applied:

      <form name="frmTestingButtonTypes">
       <button name="testButton">This is a button</button><br />
       <!-- Vs. -->
       <input name="testInput" type="button" value="This is a button">
      </form>

      Original URL remains the same when using onChange events

      Including a <button> tag passes control values as arguments to the URL
      when the first button is clicked

      Clicking the second button passes its value to the URL


      The URL examples above return two buttons would continue further if additional controls (text boxes/check boxes, etc.) on the page were populated with data.  Further, this has "navigated away" from the original blank version of the page which may require a user to click the browser's Back button to reset properly.

      Instead, use only the latter input tag method
      <input type="button" onClick="someFunction()" />
      and avoid using the button tags
      <button onclick="someFunction()">Name</button>so the arguments will not be passed to the URL.

      Additionally, avoid using the type="sumbit" in an <input> tag, which will give the same results as using <button> tags:
      <input type="submit" onClick="someFunction()" />

      Tuesday, November 8, 2011

      Changing a high pressure hose on a scuba regulator rig

      There's really not much to switching out hoses on a scuba regulator rig, but there are a few differences between high pressure and low pressure hoses.
      • Low pressure hoses have a general working pressure of around 140 psi; much lower than the pressure contained in the cylinder.  The ends are almost as wide as the hose itself to allow gas to flow through it easily.
      Wide hole of a low pressure hose

      • High pressure hoses have a working pressure that is equal to the compressed gas in the cylinder so a diver can constantly monitor how much compressed gas remains on a dive.  There is a very small hole on the end of the hose that connects to the first stage regulator.  In case of failure, a stream of gas at 3000 psi will be released, however it will only be in a tiny stream so it will take far longer to deplete the cylinder of all compressed gas.
      Changing the hose:
      • To change a rig's high pressure hose that connects the submersible pressure gage (SPG), turn over the console (if applicable) and remove the plastic protector cover from the back of the rubber housing.  This will allow you to bend the rubber console and push the gage out of the unit.

      • Bend the rubber console while gently pushing on the back of the gage.  
      • Use two wrenches to loosen the nut, then continue to unscrew the nut to remove the SPG from the hose.
      •  Back the old hose out of the rubber console.
      • Now you will be left with the gage, the "swivel spool" which is the o-ring hardware that allows the gage/console to rotate at the end of the hose, and the high pressure hose itself.  The swivel spool will remain in either the SPG or the hose, so use pliers to gently remove the piece.  Do not let any dust, hair, etc. to stick to the lubricated piece.

      • Feed the new hose through the console, replace the swivel spool in the SPG, then attach the SPG to the end of the high pressure hose and tighten.
      • Pull the hose back through the console and fit the gage snugly into place.  This may take a few minutes.  Do not use too much force or pull too hard on the hose.  A bit of wiggling should suffice.

      Read more:
      http://www.divegearexpress.com/regulators/hoses.shtml

      Friday, August 12, 2011

      Connect to ArcMap layers and tables with VBA

      Example description:
      I am editing a coverage of stream segments (lines) and would like to log any updates to a non-spatial, standalone table in the geodatabase so I can keep track of the evolution of the dataset over time.  The application will first need to know which datasets to edit, so I start by adding  two combo boxes to the form that will be automatically populated with the two necessary types of data, named cboFlowingWatersLayer, and cboFlowingWatersUpdateTable, respectively.


      The first combo box will allow me to select any of the the spatial datasets (geodatabase coverages/feature classes/shapefiles/projected datasets/etc.) that are available in the Table of Contents pane:

      Map layers in an active ArcMap project

      The second combo box will select the non-spatial, standalone table (highlighted below) that is otherwise available under the Source tab in the Table of Contents pane.  There are two additional dummy tables that I added to this project that are not visible in the screenshot below, but you'll see them later.

      Non-spatial tables in an ArcMap project

      Coding:
      I add some code to populate the combo boxes with any available layers or standalone tables when the form activates.  There's a brief Setup section, then an If/Then statement will check to see if there is a layer already set in there.  If not, it'll clear it and populate the control with any spatial layers that are available.  If there is anything in there, it will run a separate function to check if it's the right layer.  I won't address that procedure here, so it's commented out below (though I recommend adding such a function). Let's get started with filling in the names of just the spatial datasets first:

      Private Sub UserForm_Activeate()
      'Setup
        Dim pMxDoc As IMxDocument
        Dim pMap As IMap

        Set pMxDoc = ThisDocument
       
      Set pMap = pMxDoc.FocusMap

      'Populate the first combo box with any available spatial
      ' layers that will show up in the Display tab in the
      ' ArcMap Table of Contents pane
        Dim i As Integer
        If cboFlowingWatersLayer.ListCount = 0 Then
            cboFlowingWatersLayer.Clear
            For i = 0 To pMap.LayerCount - 1
                Me.cboFlowingWatersLayer.Additem (pMap.Layer(i).Name)
            Next i
        Else
            'Call Me.FlowingWatersLayerCheck
        End If

      End Sub

      What should appear when the first combo box is selected are any layers that are available the Display tab of an ArcMap project.


      (Note that apps can only work with shapefiles, geodatabase coverages, etc. and not groups of data.  Data groups appear in this example as individual layers, but since they are not really spatial datasets, selecting them will cause an error at run time if they are selected and processed.)

      Next we'll add some more code to add any standalone tables that are in the project using the IStandaloneTableCollection interface:

      Private Sub UserForm_Activeate()
      'Setup
        Dim pMxDoc As IMxDocument
        Dim pMap As IMap
        Dim pSATCollection As IStandaloneTableCollection 

        Set pMxDoc = ThisDocument
       
      Set pMap = pMxDoc.FocusMap
       
      Set pSATCollection = pMxDoc.FocusMap

      'Populate the first combo box with any available spatial
      ' layers that will show up in the Display tab in the
      ' ArcMap Table of Contents pane
        Dim i As Integer
        If cboFlowingWatersLayer.ListCount = 0 Then
            cboFlowingWatersLayer.Clear
            For i = 0 To pMap.LayerCount - 1
                Me.cboFlowingWatersLayer.Additem (pMap.Layer(i).Name)
            Next i
        Else
            'Call Me.FlowingWatersLayerCheck
        End If

      'Populate the second combo box with any available non-spatial
      ' tables that will show up in the Source tab in the
      ' ArcMap Table of Contents pane
        Dim j As Integer
        If cboFlowingWatersUpdateTable.ListCount = 0 Then
            cboFlowingWatersUpdateTable.Clear
            For j = 0 To pSATCollection.StandaloneTableCount - 1
                Me.cboFlowingWatersUpdateTable.Additem _
                    (pSATCollection.StandaloneTable(j).Name)
            Next j
        Else
            'Call Me.FlowingWatersTableCheck
        End If

      End Sub

      Finally, this is what the second combo box will look like (with the additional two dummy datasets that were hidden from view in the screenshot above - they're named "Delete - Test 1" and "Delete - Test 2"):


      Referencing the selected layer/table:
      There are a virtually unlimited number of uses for mapping layers like this.  The idea is that the method above provides a heads-up interface to access the position of a given layer or table in the Table of Contents.  Think of the position as the dataset's number in line, starting at 0 instead of 1.  Take the five spatial "layers" that are available for example:

      Place in lineVB Position #Layer Name
      1st / Top
      2nd
      3rd
      4th
      5th / Bottom
      0
      1
      2
      3
      4
      "FlowingWaters layer"
      "New Group Layer"
      "Florida NHD"
      "SWFWMD_draft_primary_canals"
      "Reporting Units"

      Whenever you need to use a specific layer, the interface we built above will allow a quick way for Visual Basic to reference the position number of a selected layer.  Of course you will need some error checking and handling code to ensure that the layer position isn't changed (adding, removing, or moving the order of layers in the Table of Contents will affect each layer's position number).

      The following are a few examples on how to reference a layer's position number using the interface that we built above.

      Example 1 - Connect to a dataset:
      A working example follows, so don't worry about the function of the code yet.  This simply illustrates the structure of references needed to connect to a dataset.

      The previous sections explain that an ArcMap project is made of up layers and sometimes non-spatial tables.  Further, those layers and tables have position numbers associated with them that are usually just unimportant background information.  Well, now we will use those position numbers to tell a program where to target its procedures.

      After we choose a layer from the program interface, that combo box/pull down menu will store our selection as a number, which it refers to as its ListIndex.  Now if we want to know which layer or table we chose, we'll call it by referencing cboFlowingWatersLayer.ListIndex.

      In the example below, we are instantiating a new variable based off of the IFeatureLayer interface (again, don't worry about what's happening yet).  We will set that new variable, named pFeatureLayer, equal to a specific layer number (position number) in an ArcMap project so we can do some more work on it later.  Just pay attention to the way that the combo box position is referenced:

      Dim pMxDoc As IMxDocument 'Whatever
      Dim pFeatureLayer As IFeatureClass 'Slightly Important
      '...more code

      Set pMxDoc = ThisDocument 'Still not the point
      'Oh, here we go!
      Set pFeatureLayer = _
        pMxDoc.FocusMap.Layer(cboFlowingWatersLayer.ListIndex)
      '...more code


      Ok! This essentially told the function/sub routine that:
      1. We're working with this project (aka ThisDocument)
      2. We're looking for a specific feature layer (spatial dataset/shapefile/geodatabase coverage/etc.)
      3. That dataset of interest will be in a certain position when you focus the map; and that position number can be found by A) looking at the combo box (pull down menu named cboFlowingWatersLayer) and B) pulling its current ListIndex value.
      Got it.  Let's move on to a working example.

      Example 2 - Count the selected spatial features:
      Add two command buttons to the form, named cboLayerCount & cboTableCount, and change their captions to match the screenshot below

      Added two command buttons

      When a user clicks on one of these buttons, a message box will report how many records are selected in a layer or a table.  I'll add a quick error check at the beginning to make sure that a layer has been selected.  If a layer has not been selected yet, the ListIndex value will be -1. Here's the code:


      Private Sub cmdLayerCount_Click()
      'Error Checking
        If cboFlowingWatersLayer.ListIndex = -1 Then
            MsgBox "Please choose a layer to count."
            Exit Sub
        End If

      'Setup
        Dim pMxDoc As IMxDocument
        Dim pMap As IMap
        Dim pFS As IFeatureSelection
        Dim pSelectedFeatures As ISelectionSet

        Set pMxDoc = ThisDocument
        Set pMap = pMxDoc.FocusMap
        Set pFS = pMap.Layer(cboFlowingWatersLayer.ListIndex)
        Set pSelectedFeatures = pFS.SelectionSet 

      'Display a message box to report info
        If pSelectedFeatures.Count = 1 Then
          MsgBox "There is 1 feature selected."
        Else
          MsgBox "There are " & pSelectedFeatures.Count & _
              " features selected."
        End If

      End Sub

      Save this, run the code, select a few features and you should get something like this:


      Example 3 - Count the selected standalone table features
      Using the same GUI (graphic user interface) that was built in the previous example, apply the following code to the "Table Count" command button to count the number of selected records in a standalone table.  A very similar method will be used for this procedure, however we will need to use the ITableSelection inteface in place of the IFeatureSelection interface since we're working with a standalone table instead of a spatial dataset.  Further, I won't need to sort through any of the selected features in the standalone table in my larger project, so I'll leave out the Selection Set and count directly from my Table Selection:

      Private Sub cmdTableCount_Click()
      'Error Checking
        If cboFlowingWatersUpdateTable.ListIndex = -1 Then
            MsgBox "Please choose a layer to count."
            Exit Sub
        End If

      'Setup
        Dim pMxDoc As IMxDocument
        Dim pSATCollection As IStandAloneTableCollection
        Dim pTS As ITableSelection

        Set pMxDoc = ThisDocument
        Set pSATCollection = pMxDoc.FocusMap
      'This next bit must be on the a single line;
      '  the format of this blog makes coding difficult.
        Set pTS = pSATCollection.StandaloneTable(
             cboFlowingWatersUpdateTable.ListIndex)

      'Display a message box to report info
        If pTS.SelectionSet.Count = 1 Then  
            MsgBox "There is 1 feature selected."
        Else 
            MsgBox "There are " & pTS.SelectionSet.Count & _
                " features selected."
        End If

      End Sub

      Now, after you map a standalone table in the Flowing Waters Update Table combo box and click the Table Count command button, you will be able to count any selected records in the table, just like you would count the records in a spatial layer.

      Friday, June 24, 2011

      PivotTables Example: Reducing Multiple Records for One Site

      Click to enlarge: Example dataset and completed PivotTable
      There is a dataset that has unique records for various pollutants for a number of locations across the state.  Thus, there are multiple instances of the same station for each of the four pollutants in this abbreviated example: CO, NOx, PB, and PM (etc.).  I gave each of these records imitation data in the Value_ppm field to illustrate how the data are moved after being manipulated by the PivotTable process.  The values for the first station group are 1.x, the second group are 2.x, etc.

      Process:
      • Open a dataset in Excel (2007) - though this is largely available in previous versions of Excel.
      • From the Insert tab choose Pivot Table
       
      • From the Create PivotTable dialog, select all of your important data (including field headings), and choose to place the new table in a New Worksheet
      • From the PivotTable wizard that will likely appear docked to the right side of the Excel window, click the menu button at the top and choose "Fields Selection and Areas Stacked" option
       

      • Select the fields you wish to be included in your final dataset.  I picked all three from my dummy dataset
       
      • Select the menu button again at the top of the PivotTable wizard and choose “Areas Section Only (1 by 4)”
      • Now drag the fields into the following order:
        - Row Lables: Station (or station name/id)
        - Column Labels: Pollutant
        - Values: Sum of Value_PPM
       
      • Remove the "Grand Total" fields by right clicking on the new table and choosing PivotTable Options
      • From the Totals & Filters tab, uncheck the first two boxes under Grand Totals and click OK
      Final Table
      •  Finally, Copy and Paste the raw field headings and data to a new, final worksheet.  From here, if you are dealing with spatial data, I suggest joining Lat/Long/Datum information to the Station in Access or ArcMap/Catalog
      Additional Grouping Fields:
      Your dataset will be a bit more difficult if you need to attach additional information included as a grouping parameter, such as an observation date.  You can start by adding the Date column (switch back to the “Fields Selection and Areas Stacked” view) to the Row Labels area of the Pivot Table wizard.  Make sure Date is first, followed by Station.

      Further grouping by Date
      • If this last table is useful, you may want to remove the group subtotals before you copy the raw data into a new worksheet.  Simply right click on a Date cell inside the newly created table and uncheck the Subtotal "Date" option