 |
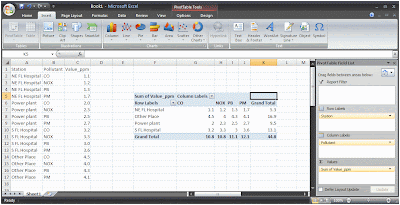
| Click to enlarge: Example dataset and completed PivotTable |
There is a dataset that has unique records for various pollutants for a number of locations across the state. Thus, there are multiple instances of the same station for each of the four pollutants in this abbreviated example: CO, NO
x, PB, and PM (etc.). I gave each of these records imitation data in the Value_ppm field to illustrate how the data are moved after being manipulated by the PivotTable process. The values for the first station group are 1.x, the second group are 2.x, etc.
Process:
- Open a dataset in Excel (2007) - though this is largely available in previous versions of Excel.
- From the Insert tab choose Pivot Table
- From the Create PivotTable dialog, select all of your important data (including field headings), and choose to place the new table in a New Worksheet
- From the PivotTable wizard that will likely appear docked to the right side of the Excel window, click the menu button at the top and choose "Fields Selection and Areas Stacked" option
- Select the fields you wish to be included in your final dataset. I picked all three from my dummy dataset
- Select the menu button again at the top of the PivotTable wizard and choose “Areas Section Only (1 by 4)”
- Now drag the fields into the following order:
- Row Lables: Station (or station name/id)
- Column Labels: Pollutant
- Values: Sum of Value_PPM
- Remove the "Grand Total" fields by right clicking on the new table and choosing PivotTable Options
- From the Totals & Filters tab, uncheck the first two boxes under Grand Totals and click OK
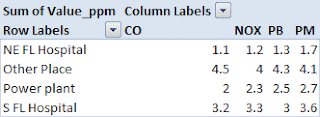 |
| Final Table |
- Finally, Copy and Paste the raw field headings and data to a new, final worksheet. From here, if you are dealing with spatial data, I suggest joining Lat/Long/Datum information to the Station in Access or ArcMap/Catalog
Additional Grouping Fields:
Your dataset will be a bit more difficult if you need to attach additional information included as a grouping parameter, such as an observation date. You can start by adding the Date column (switch back to the “Fields Selection and Areas Stacked” view) to the Row Labels area of the Pivot Table wizard. Make sure Date is first, followed by Station.
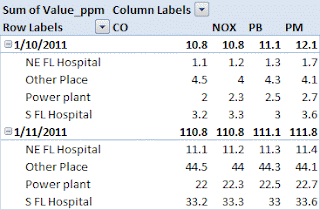 |
| Further grouping by Date |
- If this last table is useful, you may want to remove the group subtotals before you copy the raw data into a new worksheet. Simply right click on a Date cell inside the newly created table and uncheck the Subtotal "Date" option


No comments:
Post a Comment